Pump calibration is necessary to translate flow rate units of milliliters per minute to revolutions per minute (RPM) signals used by the controller box to communicate with the pumps. A linear approximation is used where the y-intercept is set to 0 and the slope is set to the calibration value measured in milliliters per revolution.
- Note: the automatic flow controller will use real-time feedback from scales to adjust flowrates in real time. It is critical to provide the controller with an accurate starting calibration slope. If the set slope deviates too much from the real slope, the controller may become saturated with the calibration error and not be responsive to viscosity differences relevant to the lysis process. Thus, care must be taken to properly determine the calibration range and collect the calibration dataset.
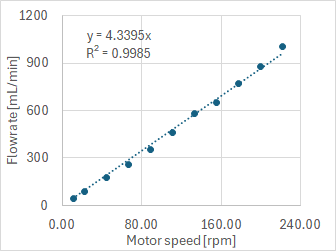
Figure 1. Example of pump calibration curve using silicone 18 tubing up to 1L/min.
- Determine the normal operating flowrate range. These values should be determined by experimental factors. For example, if the set point is 200 ml/min, a starting operating range may be 300 – 400 ml/min.
- Determine the controlled operating flowrate range, typically wider than the normal operating range. These values should be determined by controller factors. For example, if the normal operating range is 300 – 400 ml/min, and the PID controller is tuned with a low P coefficient (less than 1.0), then a controlled operating range of 100 ml/min to 600 ml may be sufficient. For larger controller P coefficients, a wider range of 10 to 2000 ml/min may be needed to cover the operation over all possible controlled states.
- Once the widest necessary flow rate range is determined, the number of calibration points should be set to cover the region adequately. For example, 11 calibration points for the range 0 to 1000 L/min was sufficient to produce the calibration curve with R2 > 0.99 as illustrated in Figure 5.
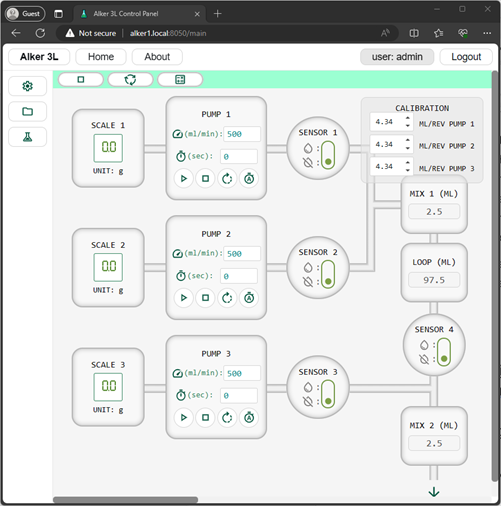
- Connect to the system in the software and click the “Set pump calibration slopes” button in the top toolbar. This will cause the “Calibration” window to be displayed in the top-right corner. If this is the first time performing calibration, a default value of 4.34 ml/rev can be used as an initial value.
- Setup the pump to be calibrated to transfer WFI into a container placed on the scale. The empty container should be set to the tare weight. The tubing responsible for adding water to the empty container should be able to transfer liquids without causing extra spillage once the pump stops. The tubing should not make physical contact with the container or any part of the scale to prevent altering the final weight.
- Add water to the source container and prime the pump by clicking “Start pump” until water reaches the target scale. Once the scale reaches a stable weight, tare the scale.
- Determine the amount of liquid V to use for calibration, for example 100 to 1000 ml, and calculate the number of seconds t to set the pump for a given flow rate F:
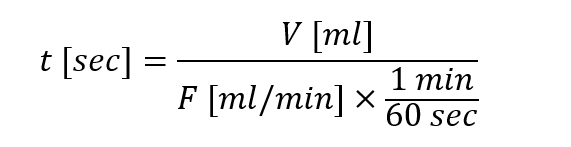
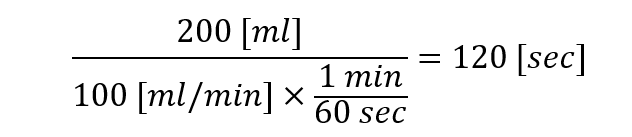
- For example, to calibrate using a volume of V = 200 ml and flowrate of 100 ml/min, the resulting pump duration would be 120 sec.
- Set these values in the software panel on the corresponding pump:
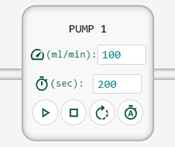
- Record the scale mass value in grams, this is the starting weight.
- Click “Start pump” and wait until the pump stops automatically.
- Record the scale mass value in grams, this is the final weight.
- Record the difference between starting and final weights and divide it by the set time in minutes to calculate the “observed flow rate” in units of milliliters per minute. It will be assumed the water used has a density of 1 g/ml.
- Repeat this procedure until all the desired flowrates are set and the observed flowrates have been calculated and recorded.
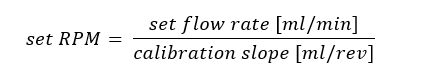
- Calculate the set RPM from the set flow rate and calibration slope value using the following equation:
- Enter all the recorded values into Excel for further analysis.
- Plot the calibration curve with the “set RPM” on the x-axis and “observed flow rate” calculated from scale reading. The result should appear similar to Figure 5.
- Add a trendline to the plot and set the y-axis to 0. Record the goodness of fit value R2 and check that it is above 0.99. If not, repeat the calibration until the linearity is adequate.
- Record the slope of the trendline as the new calibration coefficient, it should have units of milliliters per revolution.
- Repeat this calibration procedure for pumps 1-3 as needed.
Leave a Reply